
Company Focus: AER
Owning the Shortage
1/26/202612 min read
AerCap Holdings N.V.
NYSE: AER Aircraft & Aviation-Asset Leasing, Updated: 2 June 2026
Price 2 June 2026 139.50
The global aviation industry is currently in an observable multiyear structural supply deficit. Put simply, airlines need access to new planes, and manufacturers can't deliver them fast enough. The below report covers a business we believe stands to benefit from this deficit, AerCap (NYSE: AER). AerCap is the world's largest owner of commercial aircraft, engines, and helicopters. With strong recent results, Moreton Financial believe the thesis for the investment is a structurally protected asset base operated by a management team intent on achieving the singular goal of delivering returns to shareholders.
On the face of it, AerCap looks like the kind of business Moreton Financial might screen against; a debt loaded balance sheet running a capital intensive, asset heavy business model. We are, as a rule, suspicious of balance sheets that need to be constantly refinanced. However, we believe this leverage sits on the right side of the capital cycle as we will explain.
Another reason as to why we like the business (as with any good investment), is if you strip AerCap back to its fundamentals, and it does something simple. It buys aircraft and then leases them at a profit. Whilst that simplifies the business model, at its core that is what this business seeks to do. Expanding that point, the leases are provided to 300~ airlines and operators worldwide on long dated net positive terms, under which the lessor (AerCap) owns the asset and collects rent while the lessee (the airline customer) pays the ongoing fuel, maintenance, insurance, crew and airport costs.
AerCap is then able to recycle capital and recoup some of their initial investment by on selling their assets (e.g airplanes), usually at a mid point in their useful life and above their carrying value (AerCap, 2026).
The below Figures 1 and 2 illustrate how the revenue is earned across both the four business segments and how this is represented in its product offerings.
Roughly 86% of AerCap’s revenue is recurring and contracted: lease rents and maintenance payments that continue through the cycle and under long term contracts. In FY2025, the four streams were basic lease rents of US$6,679m (78%), maintenance rents of US$690m (8%), net gain on sale of US$819m (10%), and other income of US$328m (4%) (AerCap, 2026). With 78% of revenue coming from basic lease rents, the contracted annuity is by far the largest part of the business.
Our summation justifying the durability of AerCap’s returns is that the world currently cannot build enough aircraft, and it will not be able to for years. Airbus (EPA: AIR) and Boeing (NYSE: BA) are a duopoly running multi-year backlogs, engine makers are capacity constrained, and the order book is so far out that AerCap’s chief executive has said a new Airbus order placed today would not be delivered until 2032 or 2033. (AerCap, 2026).
We believe the deficit is structural rather than cyclical because the bottleneck is a manufacturing duopoly running order books that stretch years out, and new capacity takes years to build and implement.
This picture is one every Sydney property owner understands. Currently dubbed a housing crisis, population growth, poor public policy, supply costs and migration rates have pushed demand for the property ladder higher. And the supply of new homes currently is unable to keep up. Construction has lagged due to inner city land constraints and rising build costs. Because supply cannot catch up, rents and values for the existing housing have climbed. Meanwhile, current homeowners have done nothing but hold a scarce, hard to replace asset while new supply hasn’t met demand. We feel there are parallels within commercial aircraft.
The constraint is not whether people want to fly, it is the multi-year physical impossibility of building and certifying enough new aircraft. The rent therefore accrues to whoever already owns the fleet, and AerCap owns more of it than anyone.
The demand side of this is on display in our own market. Qantas (ASX: QAN), under chief executive Vanessa Hudson, is midway through the largest fleet renewal in its history, with more than 200 aircraft on order arriving over the next decade (Qantas, 2025). Hudson has been explicit that this is “a significant investment in growth and customer experience,” and the early economics are noticeable, around 60% of Jetstar’s first-half FY2026 profit improvement came from its new-generation aircraft, which burn 20% to 25% less fuel and, just as importantly, give passengers a noticeably more comfortable flight that they recognise and will pay for (Qantas, 2026).
Carriers are under structural pressure to re-fleet, for cost and equally for customer experience, at exactly the moment the manufacturers cannot supply fast enough. Qantas largely owns its fleet (55%~), but the force pushing it, the need for new planes, cannot be delivered on time, is the same constraint that fills AerCap’s order book.
As Marathon Asset Management, a London equity manager, argues in their book Capital Returns, demand is over analysed, and that the driver of long run returns is actually supply.
They argue that the durable returns in capital-intensive industries are made not by the operators with the best assets but by those positioned correctly when supply is constrained and competitors cannot add capacity (Chancellor, 2015).
Returns are therefore argued to be a function of cyclicality, and are mean reverting, and supply is what drives the reversion. Figure 3 illustrates why returns in capital intensive industries move in cycles.
As of writing, AerCap represents 3.4% of the Moreton Financial model portfolio. Its allocation represents what we believe is a structural shortage in global aircraft supply. Its returns are driven by factors with low correlation to the broader market. We believe AER represents a structural theme worth holding, accessed through a business we think is mispriced.
The business is run by managers who say, and continue to demonstrate, that they exist to make a return for shareholders, compounding book value and shrinking the share countss.
Reference List
AerCap Holdings N.V. (2026) Annual Report on Form 20-F for the year ended 31 December 2025. Filed with the US Securities and Exchange Commission, 12 February 2026, together with the fourth-quarter and full-year 2025 earnings release, 6 February 2026.
AerCap Holdings N.V. (2026) Report on Form 6-K: first-quarter 2026 interim financial information and earnings release. Furnished to the US Securities and Exchange Commission, 29 April 2026.
AerCap Holdings N.V. (2026) First-quarter 2026 and fourth-quarter 2025 earnings call transcripts (remarks of A. Kelly, Chief Executive Officer, and P. Juhas, Chief Financial Officer).
Air Lease Corporation (2026) Current Report on Form 8-K regarding completion of the take-private transaction, April 2026.
Chancellor, E. (ed.) (2015) Capital Returns: Investing Through the Capital Cycle, A Money Manager’s Reports 2002–2015 (Marathon Asset Management). London: Palgrave Macmillan.
CNBC (2026) AerCap Holdings NV (AER) stock quote. Market data, late May 2026.
GuruFocus (2026) AerCap Holdings NV (AER) price-to-book ratio history. Market data.
Morningstar (2026) AerCap Holdings NV (AER) stock price quote. Market data.
Qantas Airways Limited (2025) Remarks from CEO Vanessa Hudson, Annual General Meeting 2025, and fleet-renewal program disclosures.
Qantas Airways Limited (2026) First-half FY2026 results and CEO commentary, February 2026.
StockAnalysis (2026) AerCap Holdings (AER) and Willis Lease Finance statistics and valuation. Market data, May 2026.
High returns in an industry attract capital, incumbents reinvest and new entrants appear, all adding capacity. Because that capacity takes years to build and arrives together, supply overshoots demand and returns fall. Low returns then set the same process in reverse: capital leaves, capacity is withdrawn, and as supply tightens the survivors earn strong returns once more, beginning the cycle again.
The opposite phase of the cycle, we think is playing out currently elsewhere in the market, and shows the mechanism at work. Consider the capital pouring into data centres and AI infrastructure. The largest players have guided total capex near US$600bn in 2026, with Amazon alone near US$200bn. Additionally, some companies are spending over 50% of revenue on capex, largely funded by debt or equity raising i.e not cash the company already has (Oracle, CoreWeave). This is the upswing of the capital cycle, chasing high expected returns, drawing in vast amounts of capital. Supply is set to arrive in a wave. Whether that buildout earns its return or ends in oversupply and write downs is the question the study of the capital cycle examines.
We raise it not as a comparison but to demonstrate and frame our thesis. The supply of new aircraft appears capped for years by a manufacturing duopoly that cannot meet demand. Demand for new aircraft is facing fixed supply, and AerCap is the dominant entrant that can access supply.
Management
AerCap CEO Aengus Kelly has run AerCap since 2011 and has been inside the business for the better part of three decades (AerCap, 2026). An important reason as why we like the business is the management team. And Mr. Kelly has demonstrated a refusal to confuse growth with value creation. In Kelly’s own words in the Q1 2026 earnings call : “I’m not here to grow for the sake of growth. We’re here to make a return for our shareholders. Nothing else” (AerCap, 2026).
When Moreton Financial was founded in January 2026, we took care to articulate our investment philosophy. In the About Us section of our website, we set out the weight we place on the quality of a management team in driving long-term returns:
"Moreton Financial places significant weight on how management teams allocate capital across reinvestment…businesses that demonstrate discipline, restraint and rational decision-making are favoured over those that pursue growth for growth's sake."
This is strikingly similar to the words expressed by AerCap's chief executive, and it is a large part of why we like the business. AerCap has returned capital to shareholders as the share count has been driven down from 196.6m to 157.7m, a reduction of about 20%, through buybacks executed deliberately when the stock trades near or below book (AerCap, 2026).
Capital returned in FY2025 was US$2.6bn and management has also beaten its own initial adjusted-EPS guidance every year since 2024.
The Risks to the Thesis
An obvious risk to the thesis is what happens if AerCap refinances its debt at a higher cost of capital, weighing on margins. Given the business model reliance on revolving debt, in addition to the amount of debt on the balance sheet itself, the cost at which AerCap refinances is significant to its bottom line. The short end of the curve currently sits below AerCap's 4.1% average cost of debt across its balance sheet, so refinancing is not a present headwind. But as we consider the makeup of the Model portfolio given the macro backdrop, specific exposures and position sizes, it is a consideration.
The bear case would also involve the stated supply cycle turning; albeit we see this as highly unlikely over our current holding period and would involve significant outside capex. Additional downside considerations involve a situation if Airbus and Boeing recover production faster than expected, or a demand shock hits the market, or utilisation rates fall below 96%. Again, given the current environment, we consider these less than likely.
As investors, we want to stay close to the developments shaping the businesses we own (or in the Model Portfolio), the AerCap and Russia/Ukraine recoveries is among them.
When Russia invaded Ukraine in 2022, AerCap had a large fleet leased to Russian airlines that it could no longer repossess. AerCap wrote them off and simultaneously launched insurance claims for the loss. Those claims have since been turning into cash, and are significant to the financials, so they need to be understood separately from the operating business.
The recoveries are inflating reported earnings. The cash is real, but it needs to be acknowledged as one off when examining the business cash flows. However, the insurers were able to appeal in March 2026, and a successful appeal would require AerCap to repay up to about US$1.2bn plus interest, though management does not consider that probable. Finally, a separate reinsurance action worth about US$1.1bn goes to trial in October 2026 (AerCap, 2026). Were that action to succeed, it would be a more immediate source of upside, a further lump of cash that strengthens the balance sheet and further feeds returns to shareholders via buybacks.
Valuation
At a price of US$139.50 (2 June 2026), AerCap trades at 1.20x its Q1 2026 book value of US$116.67 and under 10x earnings, on both trailing adjusted EPS (US$15.37) and the FY2026 guide of US$14. Historically, AER has traded below book, with a ten year median of 0.89x. We examine whether this is too expensive for where the business sits currently.
AerCap earns a historical ROE of 15%, rising above 19% in the first quarter of 2026. That return is amplified by leverage, around US$43.6bn of debt against US$18.3bn of equity, so we acknowledge the level of debt that elevates this metric.
On a ROE against a cost of equity basis, returns at this level justify a multiple well above book on a reasonable cost of equity assumption; as mentioned AerCap trades on a 1.2x P/B .
We have not used a DCF for valuation purposes. Forecasting future cash flows for AerCap would hinge predominantly on where its borrowing costs sit over the next decade, and the prices it eventually sells its aircraft for. Forecasting borrowing rates for the next Fed meeting has proven difficult enough for ‘economists’, let alone over a ten year cash flow period. An average could be used, but that lacks analysis and could prove incorrect. Ultimately we don’t believe a DCF is well suited here.
We prefer to value AerCap on its book value and the return it earns on that book, both of which can be observed. Given the current supply in the market, AerCap sells aircraft above their carrying value year after year. AerCap carries its aircraft at a depreciated book value: its original cost, written down on a straight-line basis toward an assumed salvage value. Conservative depreciation means the carrying value falls faster than the asset's real-world market value when the market is in a supply deficit. So when AerCap sells a mid-life aircraft (the average asset sold in 2025 was around 15 years old) for materially more than its depreciated book, the gain is not a one off, it is the company crystallising the gap between its own conservative accounting and market reality. A 27% gain, repeated year after year, is evidence that the entire US$57.8bn flight book is carried below what it would earn if sold in the market. (AerCap, 2026).
The returns are durable because scarcity creates the pricing power, and scale allows AerCap to monopolise it, through competitive advantages that are structural.
Airbus and Boeing have allocated their popular single aisle airplanes through the end of the decade, so a new entrant with capital still cannot get aircraft, because the slots do not exist. AerCap already holds 283 firm new-technology positions (AerCap, 2026), competitors physically cannot source this. This is a central barrier that and is currently widening every year the backlog persists.
AerCap ran its owned fleet at a 99% utilisation rate through FY2025 (AerCap, 2026). This is the closest measure we have in review of AerCap’s business supply shortage. The utilisation rate measures the share of the fleet that is on lease and earning rent; as opposed to sitting idle between leases. An idle aircraft still depreciates and still carries its share of interest expense, so every percentage point of utilisation lost converts into lost margin.
At 99%, AerCap is saying that nearly every aircraft it owns has a paying customer, that aircraft coming off lease are being re-leased without delays, and that lessees are extending. (the lease-extension rate was 87% in Q1 2026).
A relevant test for any revenue line is how much it moves earnings, as share prices tend to follow earnings over the long run. Gains on sale are recognised pre-tax and largely fall through to net income, as the asset is already owned. On the FY2025 base of US$15.37 adjusted EPS, a 10% change in EPS equates to roughly US$1.50 per share, or about US$271m of net income. This implies that for the gain-on-sale line to produce a 10% EPS effect, the US$819m reported in the FY2025 income statement would need to increase by roughly a third. Given the maturity profile of the fleet, this is unlikely. This would require AerCap to sell an unusually large portion of its aircraft in a single year, and any such gain would not be repeatable in subsequent years. This is how we investigate and value businesses.
In comparison to gain on sale items, the same 10% EPS effect is produced by approximately half a percentage point of net spread applied to the lease book.
We have not used EV/EBITDA multiplies, a common metric for asset heavy businesses. We avoid it here as it adds back interest and depreciation, which are the two key costs for a lessor. Since AerCap's profitability is dependent on the spread between lease yields and funding costs, and its aircraft will lose value over time as they depreciate. For this reason we examine P/B, ROE and EPS metrics instead, and note that AerCap does not disclose an EBITDA figure in its financials.
Two drivers have led to an increasing EPS; a growing business and a reduction in share count. Adjusted diluted EPS has risen from US$10.73 in FY2023 to US$15.37 in FY2025. Weighted average diluted shares fell from 227.7m in FY2023 to 158m by Q1 2026, close to a 30% reduction, as management has bought back shares.
The FY2026 guide of about US$14.50, or roughly US$13.00 excluding gains on sale, is lower than the US$15.37 reported for FY2025. This is not a decline in the business. FY2025 included the Russia recoveries and a strong year of gains on sale, both of which the management guide excludes. Stripping those out, the underlying per-share figure continues to rise, and AerCap has consistently beaten its initial guidance. Exhibit 1 highlights the recent per share record.
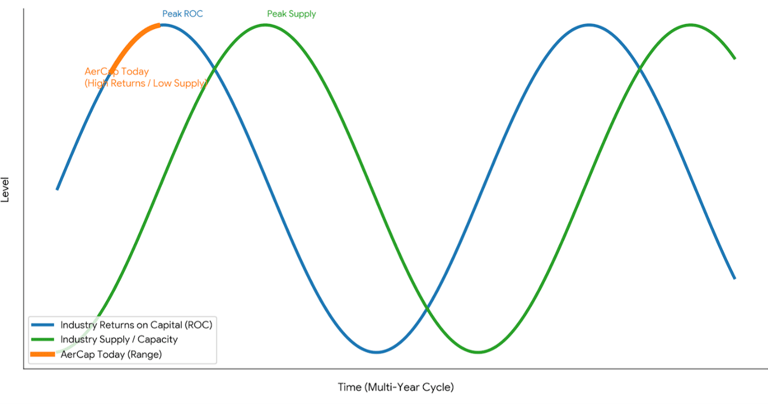
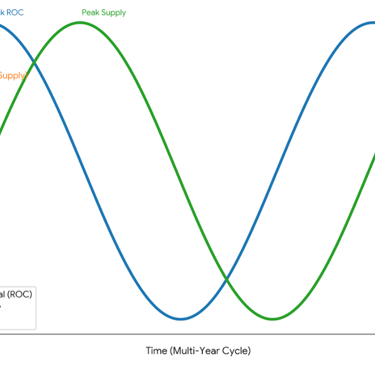
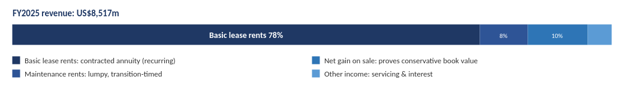
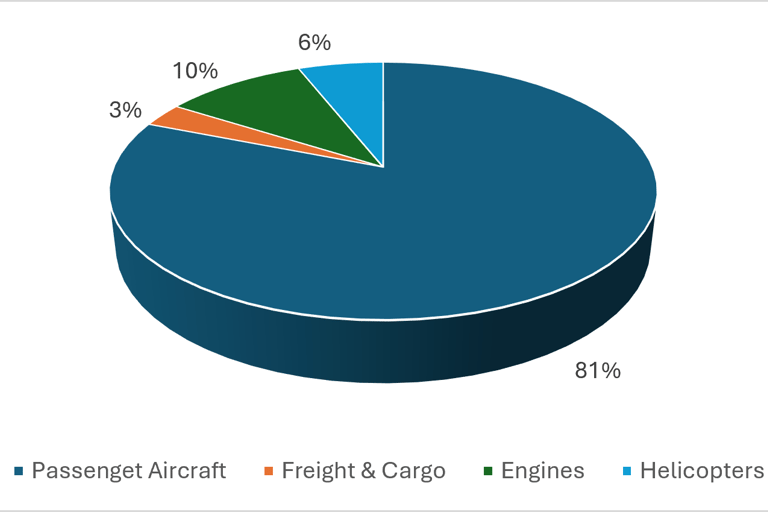
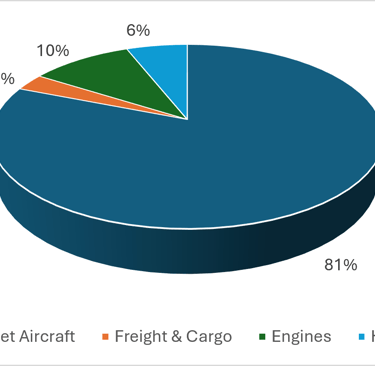
Figure 1 - AER Revenue Per Product
Figure 2 - AER Revenue Drivers
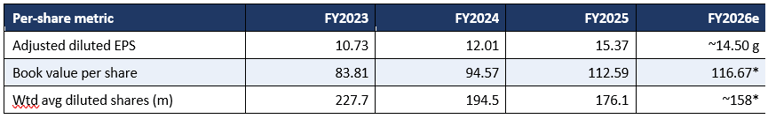
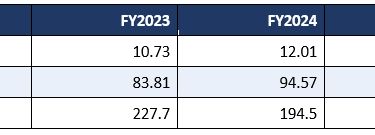
Figure 3 – Supply Cycle
Exhibit 1, AER EPS FY2023 to FY2026e
Disclaimer
This website does not provide personal financial advice. All content is general information and does not take into account individual objectives, financial situations, or needs and is not personal financial advice. Readers should seek appropriate professional advice before making financial decisions.
moretonfinancial@gmail.com
© 2026. All rights reserved.